Lili onMason


         Just another onMason site

April 28, 2014

Internet Security and Final Project

Internet Security

This week we learned about the security of online activity. The guest speaker’s bottom line was that any information stored by a device that connects to the internet can, and has already been seen by a bad guy. What I gather that means is that no information can ever be completely secure. The security built into on line sites, the antivirus software we install on our computers, all the software that we use is written by humans, and so will likely have errors in it. People who have nefarious intentions can find these errors and exploit them to get to your information. Passwords are very important. It is key that you have different passwords for different accounts and to make each password longer than 10 characters. When your password has more than 10 characters, it becomes increasingly difficult to crack.

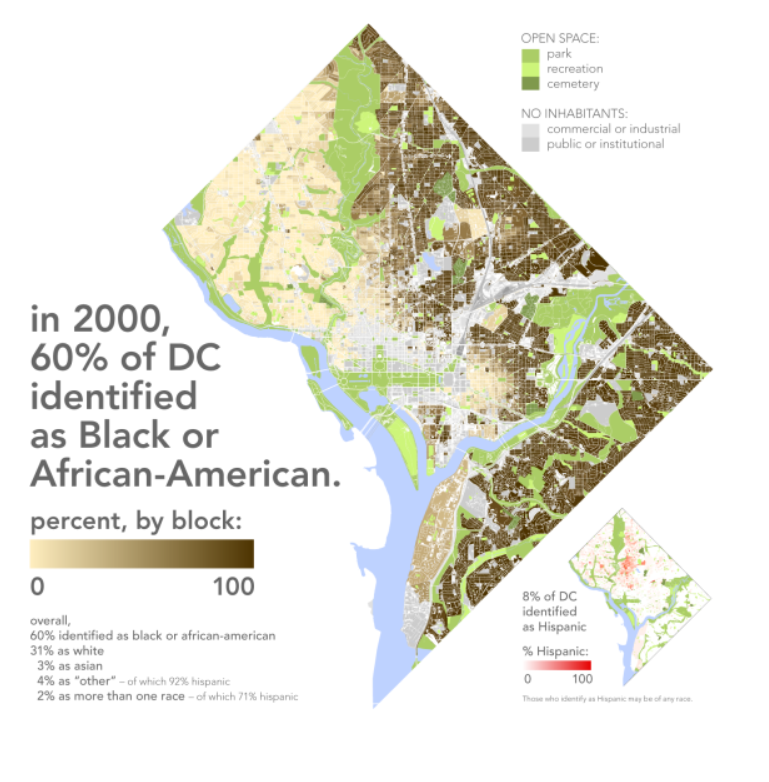
Our online presence creates data. This data can be tracked and used by both private organizations and the government. This data can be used in a variety of different manners. For example, private organizations like Facebook, and Google can use this data to target advertisements to you in particular. Governments can also use this data. They can use it to try to track demographics.

Final Project:

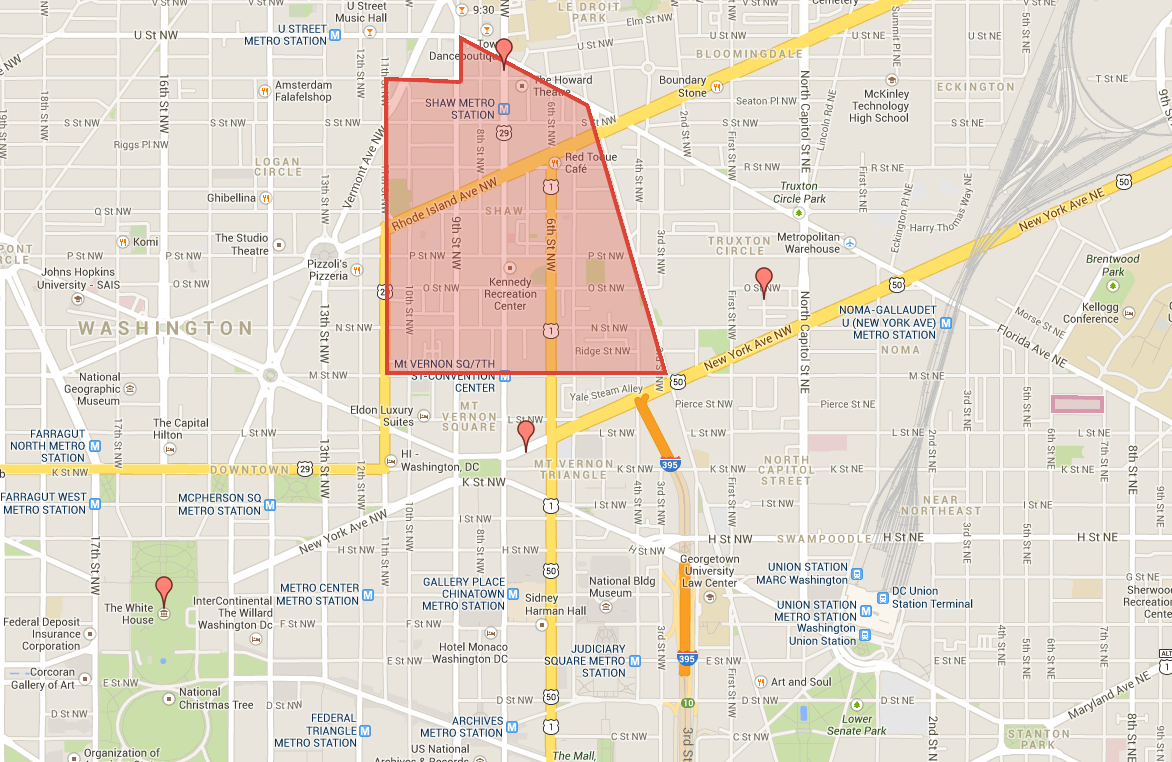
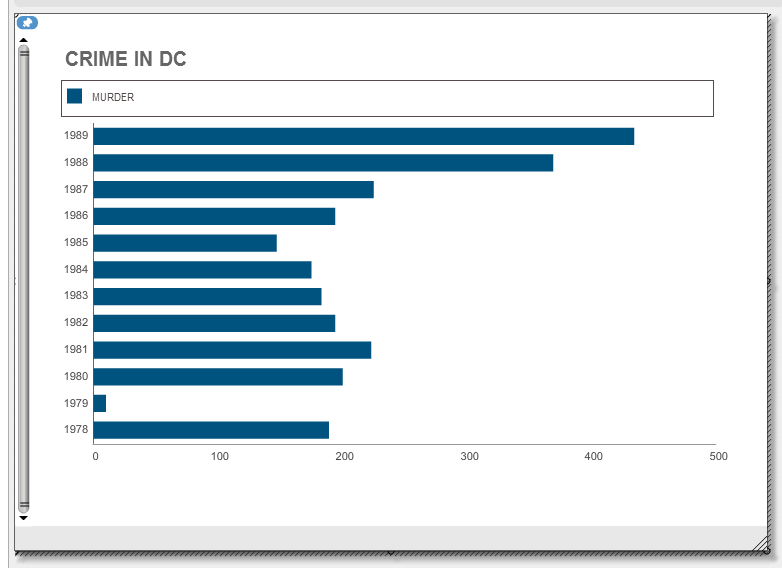
For my final project, I have created two bar graphs. They illustrate the increase of crime that occurred in DC. This increase of crime coincides with the increase of drug use. What was most interesting was the sharp increase of murders that also coincides with the increase of drug use.  Both graphs can be seen below:

crime stats dc          murder dc

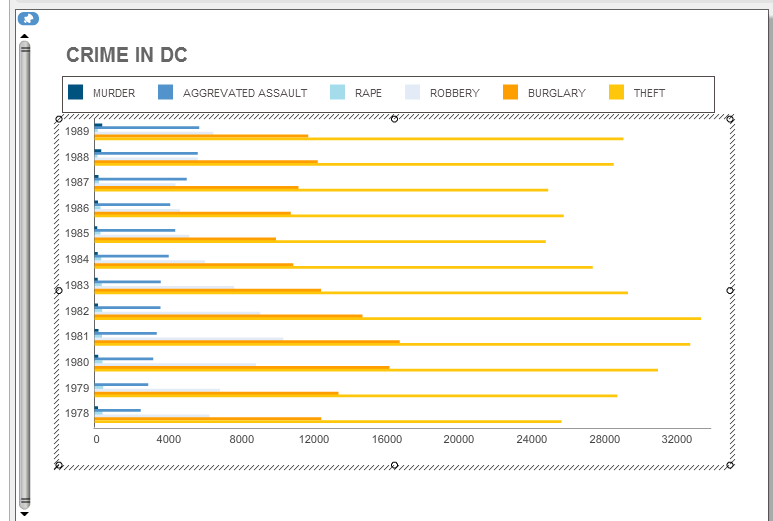
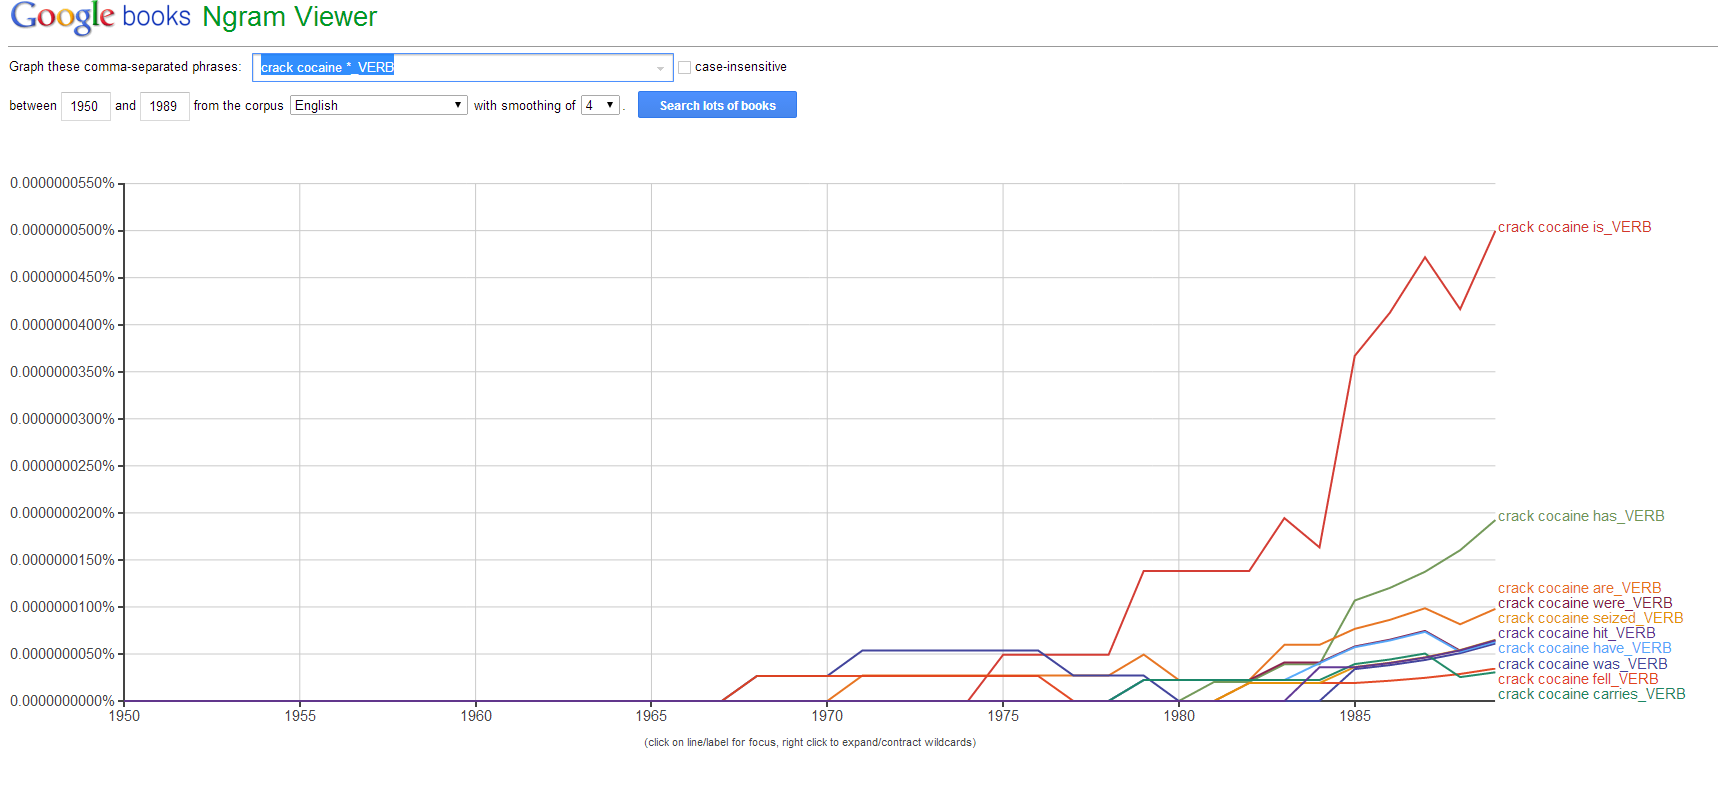
I am still having trouble finding a variety of primary sources and statistics. Most statistics started to be kept after 1991, when the nation became acutely aware and interested in how crack was taking over cities throughout the country. This obviously falls out of the 25 year time frame that has to go by for something to be considered history.

April 15, 2014

Omeka Site

Filed under: Final Project @ 8:24 pm

I am going to make an exhibit for my Omeka site. My topic is going to be the time line of how crack became popular, highlighting areas of open use and sale and key players. By making this exhibit, I will be answering the question why crack became the drug of choice to sell/what the consequences were.

Exhibit

Rayful Edmond, Alta Rae ZanvilleRayful Edmond is the most notorious crack dealer of the 80s in Washington DC. He had a heirarchy of dealers that worked for him. They often sold crack in open air, and millions of dollar. His background story highlights why the selling of crack became so prevalent in Washington DC.


hanoverplaceThis is an image of Hanover place. This image shows the drive through nature of crack buying/selling in DC. Narrow streets were often used as a place to sell drugs. Hanover place was so popular for the sale of drugs that it would cause traffic jams. Finding a place to buy drugs in DC was not only easy, but well known and the police could do very little to stop it. When drug dealers were arrested, others just stepped into their place and the sale of crack continued.


homocide rates increaseThis statistical representation shows how the murder rate increased from 1985 to 1989. I will probably use this data in order to compare it to the rate of increase of crack cocaine. It appears to be that as the use of crack cocaine increased so did the homicide/crime rates. According to WAMU, homicides increased from 225 to 369 in the span of one year (1988 to 1989); this is a rise of approximately 64 percent.

April 9, 2014

Analyzing Text

I learned to use tools to analyze text utilizing Voyant, Wordle, and Google Ngram. Each help you analyze bodies of text in different ways, but all three create visual pieces of the text being anayled.

Wordle

MLK I have a dream

I found Martin Luther King, Jr.’s “I Have a Dream” speech, copied and pasted it in Wordle. It created an image of all the words used frequently in the speech; the size of the word was dependent on the frequency of its use. The some of the most frequently used words in MLK’s speech were freedom, negro, nation, and dream. This tool is useful only if you are already familiar with the text you are researching. If you are not, the frequency of the words being used does not tell you much without the context in which they are being used. When analyzing a piece of text for a web page, or a blog, this could be helpful to drive your analysis of the text to the reader. It could be a good tool to highlight your key points.


Voyant

voyant

Voyant is very similar to Wordle. You can copy and paste a body of text into their website. It will then generate an image to represent the most frequently used words in the text. It also places the original text on the product. The negative to this site was that it does not automatically ignore words like the, and of. The positive on this website is that you can select words and it will highlight when those words are used in the text, and it will also create a graph to show you when the frequency of the selected word increases and decreases. This would be helpful in analyzing text when trying to see when a certain message was being portrayed. Like Wordle, this will only help you analyze text when you are already pretty familiar with it. You would not really be able to get text you are completely unfamiliar with and analyze it well using this site.


Google Ngram

ngram

Google Ngram allows you to search for key words you are interested in. Google then searches its vast library of books for those key words and makes a graph for you. The graph will show you the frequency of use for your key words throughout a given time frame that can be changed. I searched for “crack cocaine followed by any verb. My time frame was from 1950 to 1989. The useful part of this software is that it links to books that can be used to further your research. The actual graph is does not tell you much more than frequency. If you started here, it could help you find the appropriate time range for you research project, which would be very helpful.


Final Project

I was able to find new primary sources for my final project this week. These sources gave me ideas for new key words that led me to a very useful crime database. I was also able to add new items that I found for my Omeka site. I started creating my exhibit.

April 4, 2014

Google Map

Filed under: Theory and Practice @ 9:19 pm
Tags: , , ,

crackThis week, I created a map using Google. I added two layers. The first layer was added using Google’s spreadsheet software. I added four points, two depicting areas where crack was sold, one indicating a location where two young men were murdered, and one addressing President Bush’s anti-drug speech. The second layer showed two areas. The first, smaller, area was a place where crack was sold in extremely large quantities, and the second was  a neighborhood that stood up and took actions against the drug dealers and addicts. The tools available on Google were relatively easy to use. One difficulty, or annoyance, I ran into was in importing data. I originally made a spreadsheet using two points. I added photos to both points once I uploaded them on my map. I went back to my spreadsheet and added two more points. I couldn’t just update it on the map, I had to add a new layer, upload the updated spreadsheet, and find and attach the photos to the first two points again. It was not difficult to do, as only two points had to be re done, but this could get difficult if more points were already added. Creating this map gave me a greater insight on this topic. It gave me ideas for new search phrases. I was able to find more primary sources using these new phrases. I was also able to find information about the Shaw neighborhood, where an activist named Leroy Thorpe, Jr. led his neighbors in kicking the dealers and addicts out of their neighborhood.

March 3, 2014

Calvin and Hobbes

Filed under: Uncategorized @ 11:27 am

Professor Cafferata has a digitized copy of a Calvin and Hobbes comic at the top of the syllabus on the class website. The question is whether this violates Copyright Laws or falls under the Fair Use Doctrine. To determine if the use falls under the Fair Use Doctrine, you have to consider four factors: the first is what the nature of the use is, the second is the nature of the copyrighted material, the third is the amount being used compared to the size of the original work, and the last is what the effect of the use will be on the profitability of the comic. The Calvin and Hobbes comic is being used in a nonprofit website being used to educate student on the nature of Digital History. The comic being used only consists of four panes. While this may be all of the panes that this particular storyline  contained, it does not compare with the many more panes that exist. Finally, the use of this comic is not interfering with the original author’s sales of his comics. For  all these reasons, I do not believe that the comic violates Copyright Laws;  its use falls under the Fair Use Doctrine.

February 26, 2014

The Crack Epidemic in Washington DC

Filed under: Final Project @ 1:08 pm
Tags: , ,

dc segragationThe three topics that I talked about last week really interest me. It is hard to decide which of the three to choose. Researching the city’s planning would be fun; researching what the city was like during the civil war would be enormously interesting. The topic that I am going to ultimately study is crack, and its effect on the city. Addiction is a condition that continues to affect millions in this country. I would like to research who were the sellers, and who were the buyers. Why did they chose to do what they did? In a city with a majority of African Americans, and high segregation, what effect did the crack epidemic along neighborhood lines, and vice versa?

To continue researching this topic, I will speak to a librarian who could assist me in finding material on this subject. I would also like to find interviews with the people involved on-line. Another step I will take is to find articles already written on the subject from the school databases. I will also keep a document with hyperlinks to the data that I find interesting and usable with a description of what I would like to use from each and why. By doing so, I won’t have the problems of the past, such as losing specific citations.

February 17, 2014

Possible Research Projects

Washington DC

untitledWashington DC was first established on the 16th of July, 1790. It is the capital of our United States of America; some even call it the capital of the world. Its history is rich, complicated, and very interesting. As the capital of the country, it is often the center of controversy. When reading about the history of this city, three topic interested me: how the city was designed, the role of the District during the Civil War, and the impact the drug epidemic had on the city, and how it influenced the rest of the nation.

Most great cities of the world are recognized by their sky line; tall towers of steel and concrete reaching for the sky. One of the aspects that sets Washington DC apart is its lack of a sky line. I would be interested to research why the streets were designed how they were, what symbolism exists, and why. Who designed the city, what other visionaries competed for the job, and what the city would have looked like had someone else won the job? This research could also encompass the placement and designs of the monuments that the District is famous for.

Washington DC was a city that was a proponent of the abolition of slavery. It was completely surrounded states that were pro-slavery, namely Maryland and Virginia. It would be interesting to learn what the political climate was in the District right before the civil war. Although Maryland never seceded, it still bordered Virginia. I wonder what military units were placed there, who was in charge of them, where were they stationed and what were their living conditions? I also wonder how the District was defended. What was the experience of the people of the city, did people move, and what did the people do who stayed?

On the 5th of September 1989, President George H. W. Bush addressed the nation holding a bag of crack. He told everyone that it had been purchased right across the street from the White House. He told the nation that there was a severe problem with drugs occurring across the nations. This was especially true for Washington DC. How did the presence of drugs affect the city? Did the fact that it was a problem in the city make it a priority for the federal government? What parts of the cities were most affected and why? What actions were taken by local DC government and did it work? Who were affected by the actions and how? How did it shape the future of the city? These are all questions that could be researched on the impact of drugs in DC.

In order to research these subjects, I would look at the documents and images stored at the Library of Congress. This could provide primary, as well as secondary resources. I would also try open source searches to get an initial view of each subject. I would then use JSTOR, Academic Search Complete, and other databases available through George Mason’s Library. Finally, I would also try to find published journals, books, and periodicals in the school library.

February 10, 2014

Washington DC

articleWhen I was searching for two primary sources that taught about the history of Washington D.C.,I located a map, Bird’s-eye-view of Washington City, D.C., and a newspaper article, Schools for Freedmen. I will discuss both below. “Bird’s-eye-view of Washington City, D.C.” is a map drawn by George A. Morrison in 1872 and was published by W.H. & O.H. Morrison. The map, located at the Library of Congress, depicts a “bird’s-eye-view” of the Washington DC, with the Capitol building being the dominant landmark. The map is not drawn to scale and depicts what the District looked like at the time. Close Analysis of the map shows that it includes a legend which identifies land marks such as the Botanical Gardens, the Smithsonian, the newly completed Washington Monument, the Potomac, and Georgetown University, among others. While researching the map and its author, I found it appeared in the 1876 edition of “Morrison’s Stranger’s Guide for Washington City.” Based on this, this map was probably drawn to help tourists find their way throughout the Capital.  I researched the map, Morrison, and the book it was published in, but failed to find anything more.

“Schools for Freedmen,” (pictured on the upper left corner) is an article written in the newspaper, Harper’s Weekly, on 30 March, 1867. According to the New York Public Library, this newspaper was an illustrated magazine which covered politics, the military, and cultural stories.  The article did not include a byline.  The author wrote how the newly “freedmen” of the south had begun to make strong efforts to educate their children. The author speaks of schools being built. It highlights a school that was built near Washington DC whose dual purpose was to provide primary education while simultaneously training the children to farm. With that aim, the school was built on a farm of one hundred acres. A picture of the farm was also included in the article. The author had an obvious favorable bias on the situation. Other websites, such as npr.gov, verify that schools for former slaves were built in or near DC. Further research showed that many great schools for African Americans were built in DC, schools including Howard University. Both sources were difficult to work with. This was probably due to their age. I tried searching for more information to further contextualize, or corroborate the information found, but I was not able to find much.

February 3, 2014

Useful Digital History Sites

Filed under: Theory and Practice @ 6:07 am
Tags: ,

American Originals Part II

PortraitAmerican Originals Part II is a website which presents some of the most important original documents in U.S. History. Documents such as General Lee’s demand for surrender. The documents are example of those stored by the National Archives and Records Administration. The web page organizes the documents chronologically and categorically. The pages include images and summaries of the documents along background information.

The website is extremely easy to navigate. The homepage contains links to all of its information in an easy to navigate format. The web page was made in order to entice a general audience to be interested in the National Archives. The most interesting part of the website are the images of the original  documents. Reading the original documents gives the reader an intimate view of history.  The website does not take full advantage of the technology available. It has not been updated since 1 July, 1998.

Digital History

boys_cotton_LGDigital History is a website which presents the history of the United States. The website’s historical content was created by Steven Mintz, a director form the Columbia University using a wide variety of sources such as text books, primary sources, essays and films. It is presented by the University of Utah. I found this website to be credible.

The website is easily navigated. It is organized chronologically from the arrival of the first people to America to the 21st century. The information is further organized into categories, such as people, events, and music, through the use of tabs. I found this method of organization helpful. I could pick a time frame, such as the Great Depression, and learn about it navigating the different tabs. It even provides links to other sites that contains useful information about the topic. While the website quotes primary historical documents, it does not have images of those original documents. It appears that the website was written for students and any audience interested in American History.

Both websites are easily navigated, credible and useful. They are both clearly written and can be used for interest as well as research.


January 27, 2014

Second Week

Filed under: Theory and Practice @ 3:53 pm
Tags:

Parking at Mason

Parking is not ideal at Mason. I got used to the small campuses that NVCC consisted of. I would enjoy the walking if it were not for the cold and snow. Here is a hyper link to YouTube.

Next Page »

© 2024 Lili onMason   Hosted by onMason